Anyone can look up a competitor's ads. What no ad library tells you is which of those ads are worth copying. So we compared the ads of B2B advertisers getting the lowest cost per result with the ads of advertisers in the bottom third.
About this benchmark
Every figure below reads the same way: "41% vs 25%" means 41% of a typical leader's ads on that platform have the feature, against 25% of a typical bottom-third advertiser's. Each advertiser counts equally, so one advertiser with hundreds of ads can't swing a result.
This report is a companion to The State of B2B Paid Advertising 2026, which found that how you sell predicts where you spend. Here we look at what goes into the ads, and the same pattern shows up: the best offer depends on your GTM motion.
1. On Google, the leaders' ads stay up. On Meta, they come down.
How long an ad has been running is the one hint of performance that every ad library shows. It turns out to mean opposite things on the two biggest platforms.
On Google, 80% of the leaders' ads had run for more than 60 days, against 58% for the bottom third. Their typical ad had been running for 268 days, against 105. On Meta, it flips: only 14% of the leaders' ads ran past 60 days, against 32%, and their typical Meta ad came down after 24 days, against 45.
Both gaps hold in ABM, Demand Gen and PLG alike. One likely explanation is how people meet the ads. A search ad appears to someone new each time they search, so a good one can keep working for months. A feed ad reaches the same people again and again, so it wears out, and the leaders refresh theirs sooner.
| Motion | Leaders | Bottom third |
|---|---|---|
| ABM | 83% | 66% |
| Demand Gen | 83% | 58% |
| PLG | 70% | 51% |
Meta
| Motion | Leaders | Bottom third |
|---|---|---|
| ABM | 15% | 38% |
| Demand Gen | 15% | 41% |
| PLG | 7% | 15% |
2. Leaders write more headlines
Most leaders don't put their money behind one ad. They write many versions. On LinkedIn they ran 49 different headlines per 100 ads, against 34 for the bottom third, and the gap holds in every motion: ABM 48 vs 39, Demand Gen 48 vs 32, PLG 55 vs 28.
At the extreme, one Demand Gen leader ran 162 different headlines across 240 LinkedIn ads, and two others ran 137 and 103. A few leaders do the opposite and put a third or more of their LinkedIn ads behind a single message, such as a brand line, a playbook or a product launch. Either way, it looks like a choice rather than a default.
On Google the same habit takes another form: one headline for each thing people search for. One leader writes a headline per product, another one per role its product covers, another one per tax situation. Two of them ran 96 different headlines in 112 ads and 85 in 106.
Example ads from advertisers outside the benchmark. They show the pattern; they aren't the leaders' own ads.
3. Leaders ask the buyer a question
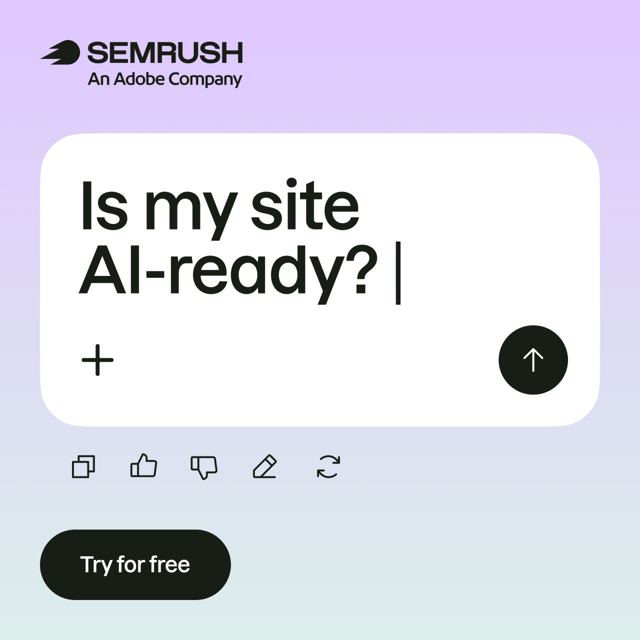
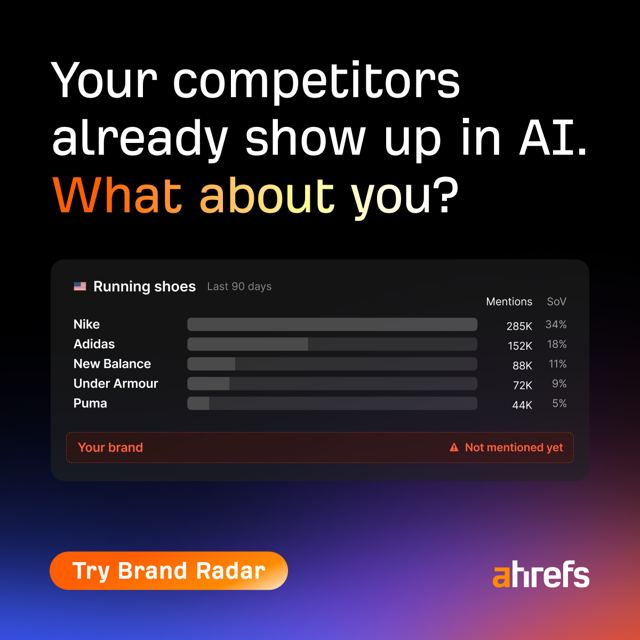
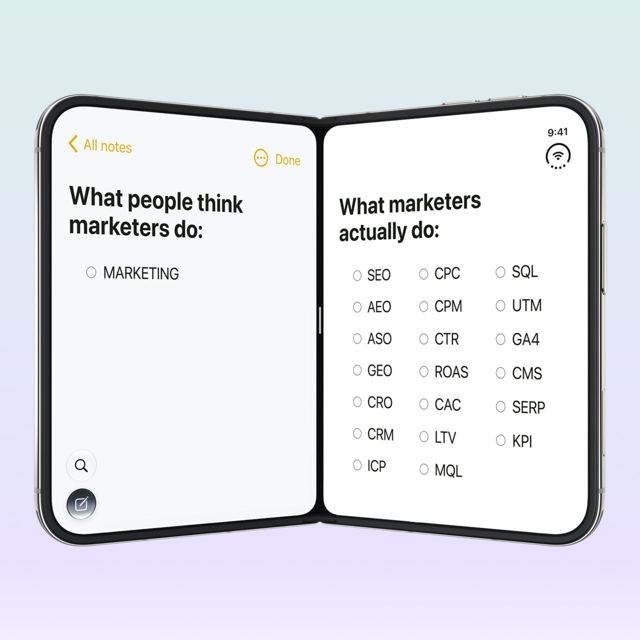
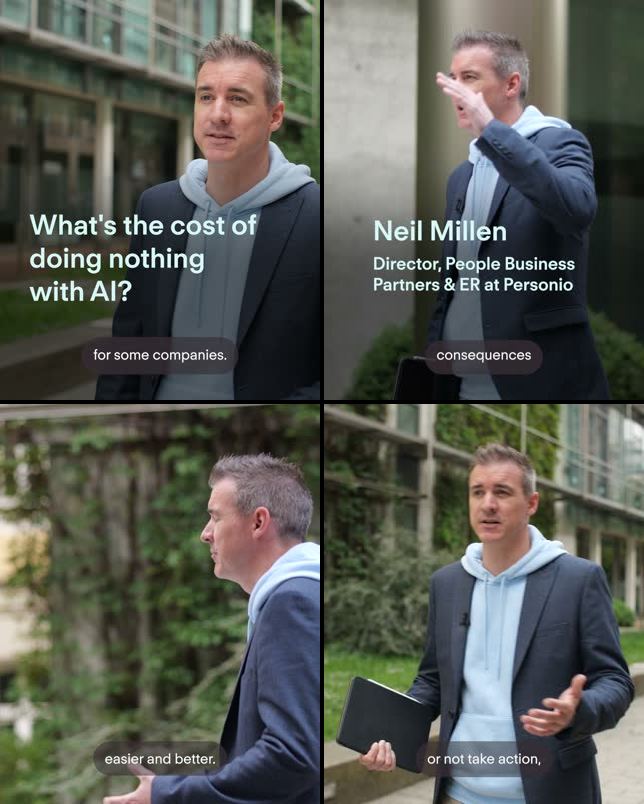
On LinkedIn, 41% of the leaders' ads ask the reader a question, against 25% for the bottom third. The gap is widest in Demand Gen, at 58% vs 24%, and it's there in ABM (33% vs 27%) but not in PLG.
The question often goes on the image itself: 15% of the leaders' LinkedIn images vs 3%. They style the image as a search history of the buyer's worries or a to-do list, ask whether AI assistants recommend a competitor instead of you, or ask HR teams, in their own language, whether they're lost among employee benefits. On YouTube, ABM leaders open with a question in 54% of their ads, against none in the bottom third.
The questions that work are ones the buyer is already asking themselves, not quiz questions about the product.
Example ads from advertisers outside the benchmark. They show the pattern; they aren't the leaders' own ads.

4. Leaders open on the buyer's problem, not a face
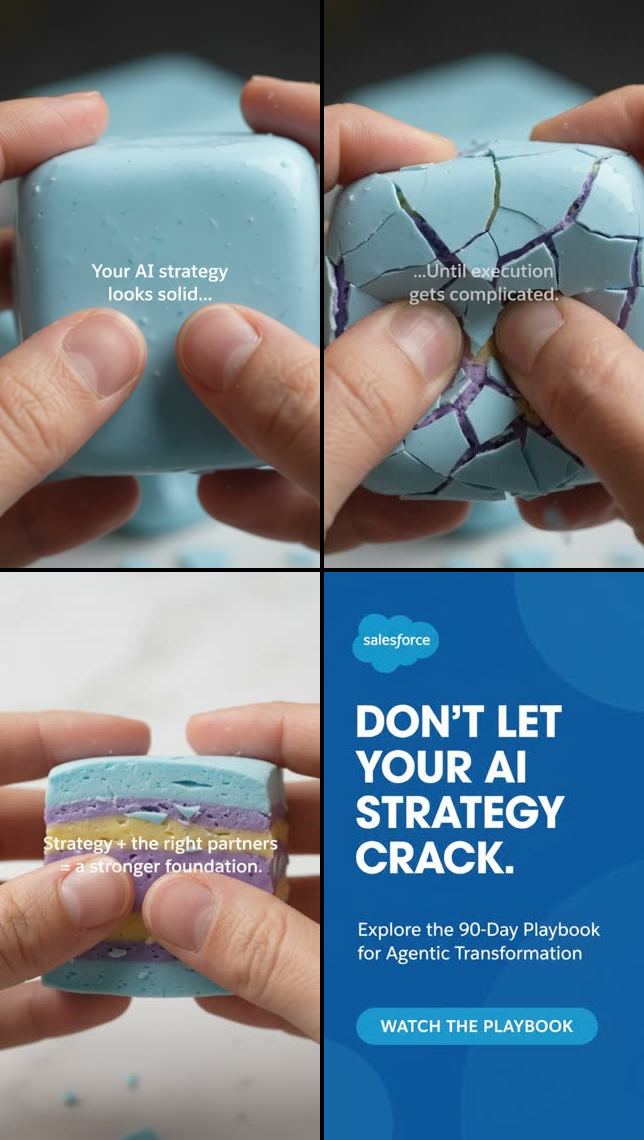
The leaders' Meta videos open on the buyer's problem in 34% of cases, against 12% for the bottom third, and on something unexpected that stops the scroll in 20%, against 10%. The bottom third more often opens on a person: someone talking to camera appears in 63% of its Meta videos, against 46% of the leaders'. The bottom third also shows its product more (78% vs 61%).
Still images follow suit. On Meta, the image is a photo of a person in 21% of the leaders' ads vs 38%, and a product screenshot in 14% vs 28%. On LinkedIn, the buyer's problem opens the image in 9% of the leaders' ads, against 4%.
YouTube is the exception. There the leaders show their brand within the first three seconds (62% vs 45%, in every motion), likely because a viewer can skip a YouTube ad after five seconds.
Example ads from advertisers outside the benchmark. They show the pattern; they aren't the leaders' own ads.
5. The offer that works depends on how you sell
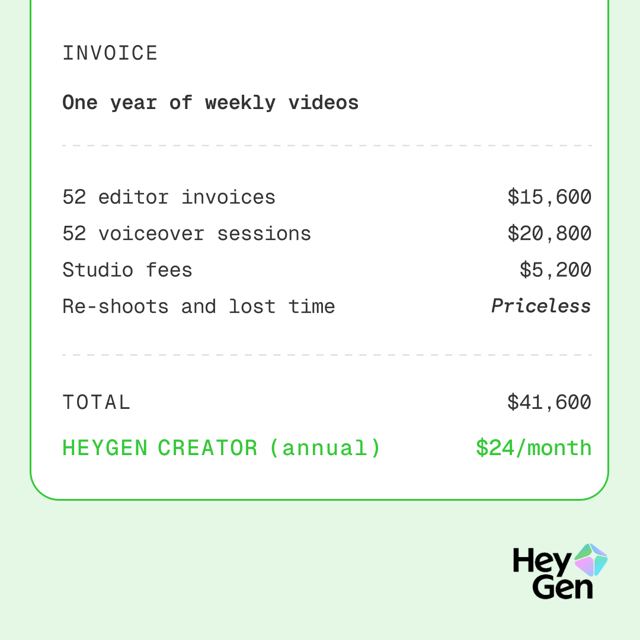
The State of B2B Paid Advertising found that GTM motion predicts channel mix better than industry does. The same is true of the offer inside the ad. Each motion's leaders have their own, and it barely shows up in the other two.
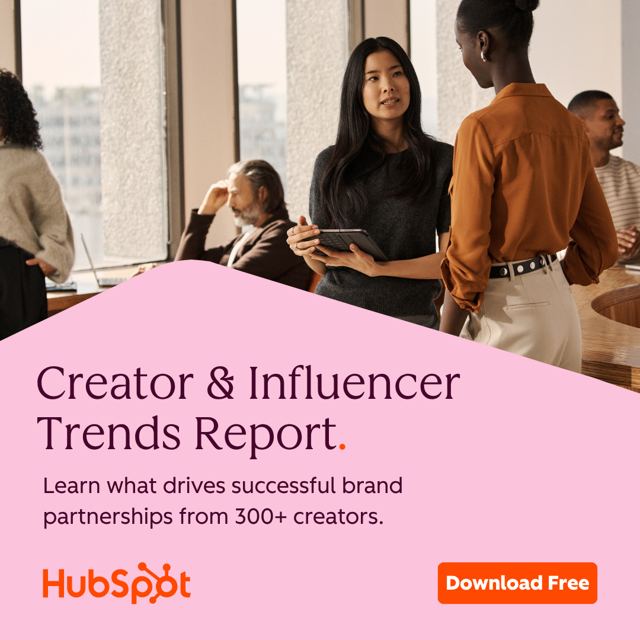
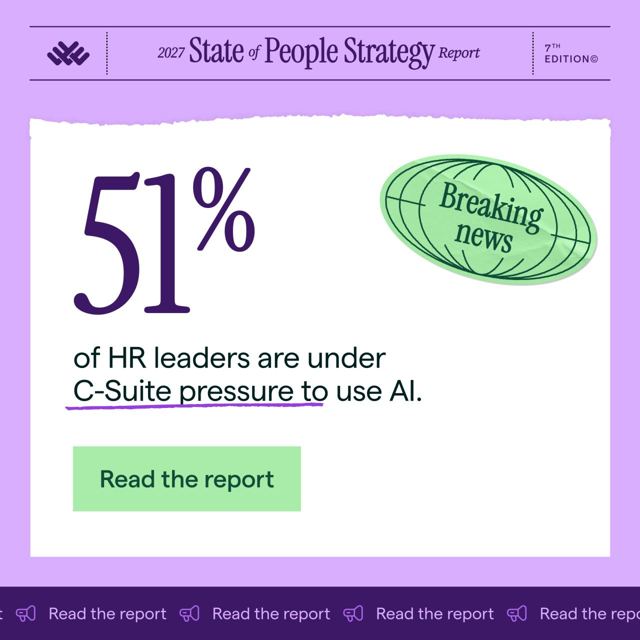
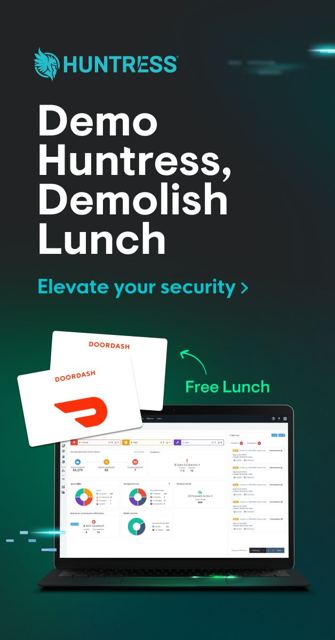
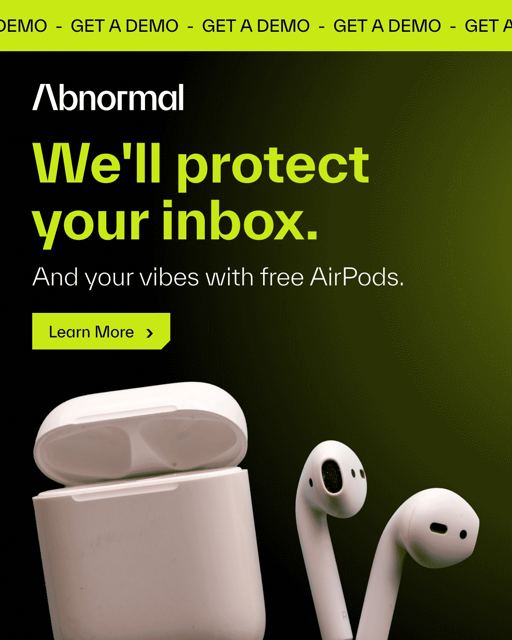
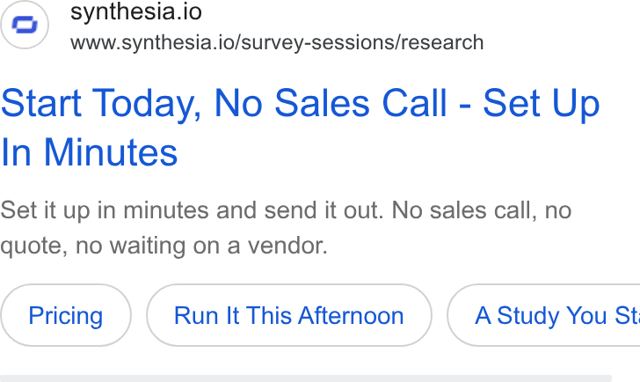
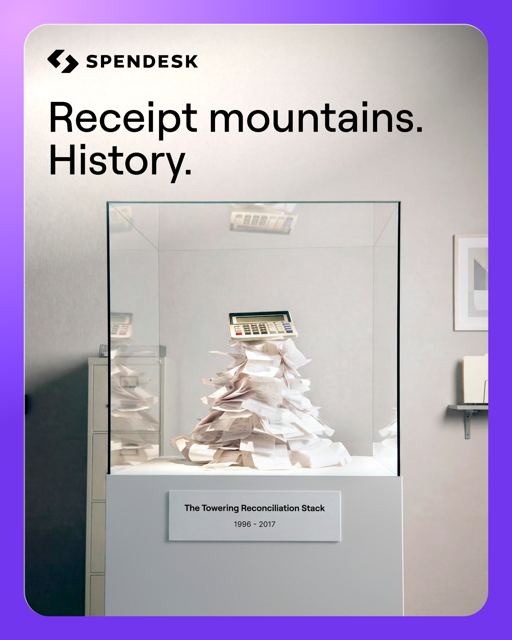
Example ads from advertisers outside the benchmark. They show the pattern; they aren't the leaders' own ads.
Demand Gen leaders also send more LinkedIn message ads, the kind that land in the reader's inbox from a named person: 14% of their LinkedIn ads vs 5%. Theirs run about 78 words, against 93, and three leaders put the gift on the button itself.
6. Several popular moves are more common in the bottom third
Some of the most repeated advice in B2B advertising is to run more video, show your customers and post from your people's profiles. In this data, the bottom third does each of those more than the leaders do.
That doesn't mean these formats fail. It means they aren't what separates the advertisers with the lowest costs from the rest, so they're poor things to copy just because a competitor runs them. When the leaders do use video on LinkedIn, it's mostly animated text and visuals with captions, and less often scripted live action (7% of their videos vs 20%).
No difference between the groups
- Asking outright for a demo or meeting, on every platform.
- A price or discount in Google ads (2% vs 2%).
- A percentage or multiplier in the LinkedIn copy, such as "72%" or "3x" (12% vs 14%).
- LinkedIn document ads (4% on both sides) and Meta's dynamic creative (32% vs 35%).
- Personalizing LinkedIn message ads with the reader's job title or company (46% vs 49%), and a softer second button such as "Tell me more" (33% vs 37%).
- Where the ads send people: the type of landing page, pages built for the campaign, and booking tools.
7. Thought Leader ads: leaders use fewer, and not team photos
Thought Leader ads are LinkedIn ads posted from a person's profile instead of the company page. They make up 7% of the leaders' LinkedIn ads, against 15% for the bottom third, lower in every motion. Only one leader posts 30% or more of its LinkedIn ads this way; four bottom-third advertisers do.
The bigger difference is what's in them. Among advertisers that run five or more, the bottom third illustrates them with photos of the team, the office or an offsite (45% of images, against 18% for the leaders), and with clips from podcasts and TV interviews (36% of videos, against 5%). The leaders post designed work, such as research posters or a billboard campaign, or film the person making their point straight to camera (20% of videos, against 2%).
Who posts, how they write and what they ask for are the same on both sides. A CEO or founder posts about half of them, the posts run about 165 words, and a demo request appears in 1%.
An example ad from an advertiser outside the benchmark. It shows the pattern; it isn't a leader's own ad.
8. On Google, leaders lean on search, awards and rivals' names
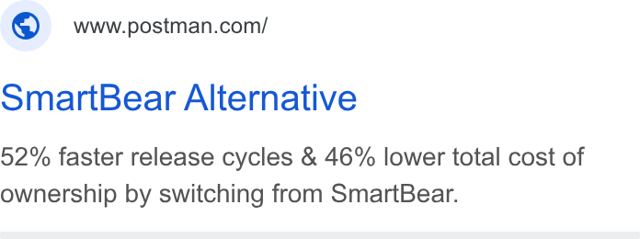
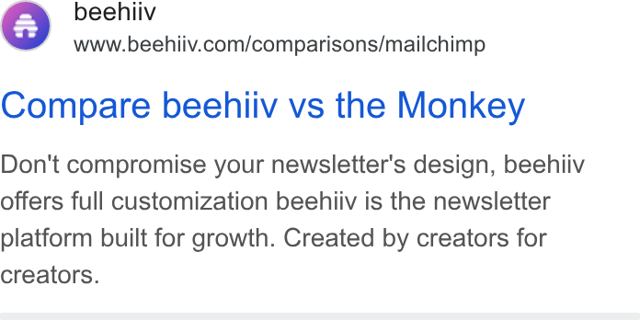
Search makes up 77% of the leaders' Google ads, against 66%, and YouTube a smaller share (14% vs 23%). Inside those search ads, ABM and PLG leaders mention awards, G2 ratings or "#1" more often (11% vs 6% overall), and name a competitor or say "alternative" more often (13% vs 9%). Their competitor ads ask about a rival's weak spot, such as fees adding up or an email tool you've outgrown, and send the click to a page about that competitor.
A few leaders also buy the cheapest clicks there are: searches for their own name typed wrong, or for the name they had before a rebrand.
Example ads from advertisers outside the benchmark. They show the pattern; they aren't the leaders' own ads.
How to read a competitor's ad library
LinkedIn's Ad Library, Meta's Ad Library and Google's Ads Transparency Center are free, and most B2B marketers have scrolled through a competitor's ads at some point. The findings above suggest five rules for reading them.
6 steps from ad library to campaign plan
What you learn sends you back to step 2 (a new angle) or step 4 (a new audience). In Primer, steps 1 to 4 can happen in one conversation: ask for a company's current LinkedIn, Meta and Google ads, find the companies that likely use it, and build and check the audience. Step 6 is asking what to change.
Every gap we measured
Every feature where the leaders and the bottom third differ by at least five points, in at least two of the three motions (or by a wide margin in one). Choose a motion to compare only advertisers that sell the same way.
Within one motion, each figure averages only a few advertisers a side, so read single rows with care. A dash means too few advertisers to compare.
Methodology and important caveats
- The benchmark. We looked across hundreds of B2B advertisers. Leaders were ranked within the same GTM motion and platform, among advertisers that spent $5,000 or more there, on results from August 5 to November 2, 2026. A result is a LinkedIn lead form submission, a Google conversion adjusted for the share of converters that fit the advertiser's ideal customer profile where we could measure it, or a Meta conversion credited to a click on an ad set that counts only lead events. Each leader needed 20 or more results (100 or more for PLG, where sign-ups are cheap). We removed advertisers whose costs looked too low for what they counted, whose leads matched none of their own ICP, or who sell to consumers.
- The groups. We classified the leaders and the bottom-third advertisers into ABM, Demand Gen and PLG groups. The bottom third are the biggest spenders in each group with no platform in the top third. GTM motion comes from each company's website, set by hand where the website was ambiguous.
- The ads. Every ad that ran from July 5 to November 8, 2026, from an ad-library data service and the platforms' own public libraries: 3,030 leader and 3,695 bottom-third LinkedIn ads, 390 and 756 Meta ads (paused ones included), and 3,246 and 3,582 Google ads, with YouTube videos watched for their first 90 seconds. For some of the largest advertisers we have only the most recent part of the window.
- How ads were read. Copy was matched against keyword lists, and the matches spot-checked by hand. A model looked at every image and video against a fixed checklist (what it shows, how it opens, what it offers, whether a person or the product appears), and we checked its answers against the frames. The bottom third's images and videos were sampled, up to 40 images and 15 videos per advertiser and platform.
- Each advertiser counts equally. Figures are each advertiser's own share, averaged. An advertiser counts on a platform only if it ran 10 or more ads there.
- What it can't say. We can't see results for individual ads, so nothing here says which ad worked. With 20 advertisers a side, and fewer within each motion, treat each gap as an idea to test. Gaps that hold in all three motions (how long ads run, headline variety, LinkedIn video) are the strongest.
- The example ads. To keep the benchmark advertisers anonymous, every ad shown comes from an advertiser outside the benchmark, chosen because it makes the same point as an ad the leaders ran. The figures come only from the leaders and the bottom third.
An ad library shows you what a competitor says. This benchmark is a way to judge which of those things are worth copying, and a reminder that the only way to know is to test it on your own buyers.